When to believe your eyes (or at least the data table)
When trying to obtain data for use in any kind of forecast you are faced with any number of questions with varying degrees of complication. Is the data from a reliable source? Do we have enough of it? How should it be interpreted? When is it stable enough to be relied upon?
That latter question is where this post will focus. Generally, more data is better than less data. Nate Silver fans’ ears will prick up at that simplistic statement as his excellent book The Signal and the Noise is full of instances where too much data can cloud our judgement, but for our purposes let’s say that when trying to judge the quality of a team you’d prefer to have data for 10 games rather than 5 (data from every game in Liverpool history would start to be too ‘noisy’ as Bill Shankly or Ian Rush have little bearing on the current crop of players).
After two games last season, Everton had amassed 42 shots (26 SiB) giving them a crazy 21(13) average. While the team played well the rest of the way, their totals of 14 shots and 8 SiB were considerably below that initial surge, which could have led to a couple of panic buys as managers sought to get 'coverage' of 'must own' teams. Looking at this season to date, what should we make of West Ham's 35 shots (22 SiB) or Swansea's 15(7) efforts?
More learned statisticians will likely be able to analyse this question with more certainty and skill, but for our purposes, we are just looking for a quick guideline as to when we can believe what the data is showing us.
For simplicity, I have simply plotted each teams’ average shot totals (both in total and those only in the box) for the season against the rolling average on a gameweek-by-gameweek basis. These lines will obviously converge as the season progresses but the speed at which this happens is less obvious. The data is plotted below with some quick analysis below the chart:
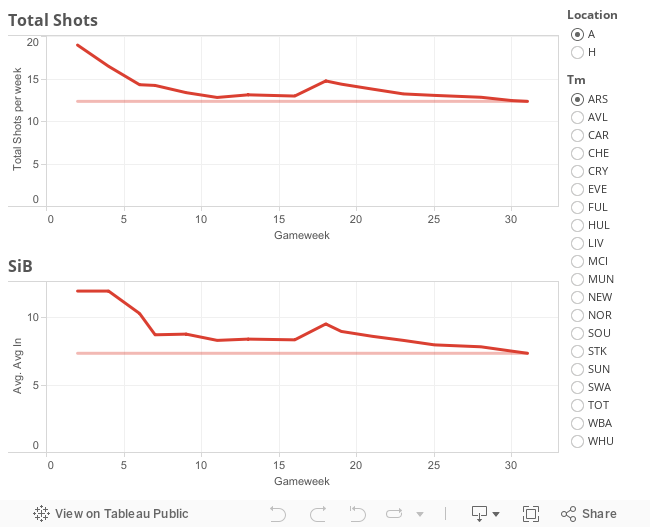 By GW6, of the forty team/location pairs (20 teams each at home/away), 34 see their rolling average within just two shots of their final season total. Thus if at that the point in the season a team had an average shot total of 10, we’d expect with some certainty that they would finish the season with between 8-12. The only notable departures were Sunderland at home, who fell from three strong performances (strangely including Arsenal and Liverpool) and a 21 shot average to just 14 on the season and then Liverpool at home, who improved throughout the year, taking their 15 shot average through GW6 to 21 by the time they fell just short of a title bid.
It's dangerous to draw too many conclusions through six weeks, especially when further splitting the data in home/away games but ultimately we can't wait until we're absolutely sure (if that day ever even arrives) as decisions on transfers need to be made sooner rather than later. Still, six weeks feels like a good benchmark to start taking things a bit more seriously and putting some weight behind any big revisions to impressions you had coming into the year. From memory of Silver's aforementioned book, I think this is something akin to Bayesian inference, where our initial hypothesis should be impacted by new data but to varying degrees based on how strong our initial opinion was. Thus, if you loved Alexis Sanchez coming into the season, his somewhat disappointing three shots in two games should move the needle less than David Nugent's zero SiB, as you were probably less sure on the Leicester man's prospects initially (though even there, two weeks is probably too early to panic unless you've seen any real issues with his or Leicester's gameplan).
After being away for a few months I'm sure everyone is thrilled to read a piece which basically tells you what you already knew, but hey, I had limited data to play with while on a recent flight and this is what I managed to cobble together. This also ties in well with my plan to launch the new graphics and forecast tables right around the GW6 mark. Next up is some actual analysis of the new season.
That latter question is where this post will focus. Generally, more data is better than less data. Nate Silver fans’ ears will prick up at that simplistic statement as his excellent book The Signal and the Noise is full of instances where too much data can cloud our judgement, but for our purposes let’s say that when trying to judge the quality of a team you’d prefer to have data for 10 games rather than 5 (data from every game in Liverpool history would start to be too ‘noisy’ as Bill Shankly or Ian Rush have little bearing on the current crop of players).
After two games last season, Everton had amassed 42 shots (26 SiB) giving them a crazy 21(13) average. While the team played well the rest of the way, their totals of 14 shots and 8 SiB were considerably below that initial surge, which could have led to a couple of panic buys as managers sought to get 'coverage' of 'must own' teams. Looking at this season to date, what should we make of West Ham's 35 shots (22 SiB) or Swansea's 15(7) efforts?
More learned statisticians will likely be able to analyse this question with more certainty and skill, but for our purposes, we are just looking for a quick guideline as to when we can believe what the data is showing us.
For simplicity, I have simply plotted each teams’ average shot totals (both in total and those only in the box) for the season against the rolling average on a gameweek-by-gameweek basis. These lines will obviously converge as the season progresses but the speed at which this happens is less obvious. The data is plotted below with some quick analysis below the chart:
It's dangerous to draw too many conclusions through six weeks, especially when further splitting the data in home/away games but ultimately we can't wait until we're absolutely sure (if that day ever even arrives) as decisions on transfers need to be made sooner rather than later. Still, six weeks feels like a good benchmark to start taking things a bit more seriously and putting some weight behind any big revisions to impressions you had coming into the year. From memory of Silver's aforementioned book, I think this is something akin to Bayesian inference, where our initial hypothesis should be impacted by new data but to varying degrees based on how strong our initial opinion was. Thus, if you loved Alexis Sanchez coming into the season, his somewhat disappointing three shots in two games should move the needle less than David Nugent's zero SiB, as you were probably less sure on the Leicester man's prospects initially (though even there, two weeks is probably too early to panic unless you've seen any real issues with his or Leicester's gameplan).
After being away for a few months I'm sure everyone is thrilled to read a piece which basically tells you what you already knew, but hey, I had limited data to play with while on a recent flight and this is what I managed to cobble together. This also ties in well with my plan to launch the new graphics and forecast tables right around the GW6 mark. Next up is some actual analysis of the new season.

Comments
Insightful post. Your data follows along with several others such as TSR and xG which show fairly high correlations from 6 game samples to full season results. My personal ratings (which are based upon shots on target, shots in box and clear cut chances) show r-squared values of 0.6 when comparing GW6 attacking results to full season metrics. Given all of these, I think we should all be pretty confident in our analysis of teams come end of September; the good teams then will most likely be the good teams at the end of the year.
Note: When defining good, I am NOT referring to goals or points as these are far too random, but of more comprehensive metrics involving shots and chances.
A perfect example this season is Manchester United. If they go all out crazy and sign Vidal, a great centre-back and even yet another midfielder we would perhaps reserve judgement on them until the end of October.
Missed this blog
Hope you enjoyed your 1 year hiatus Mr Guardiola of the fantasy football analysis world